Rasmus Jørgensen (rj@fixrs.dk) Copenhagen Business School
Torben Pedersen, Copenhagen Business School, Christer Hedlund, Mid Sweden University, and Johan Lilja, Mid Sweden University
Presented at EUROMA2023. Get PDF version here.
Introduction
Continuous harvesting of natural resources for production of goods is a practice that has reached its limitation as demonstrated by the loss of biodiversity and climate changes. To reduce the use of natural resources manufacturers are adopting circular economy principles in pursuit of disconnecting the production of goods from the usage of natural resources (Bocken et al., 2016; The Ellen MacArthur Foundation, 2013). Operationalization of circular economy happens through initiatives like product take-back which spans from collecting a product from an end-user until the product or its material is re-introduced in the market and thus creates value for the business (Bockholt et al., 2020). From a resource perspective the purpose of a take-back system is to reduce use of new natural resources by replacing them with reused products or recycled materials in the production of goods (Lewandowski, 2016).
Reuse or refurbishment of discarded products reduces waste and energy consumption by retainment of a product’s functional value (The Ellen MacArthur Foundation, 2013; Zacho et al., 2018). However, collaboration among many actors is required to be able to create a system for reuse or refurbishment of discarded products. A system for taking back the discarded products entails processes of reverse logistics, transportation, handling and assessing the discarded products that come back in many versions and qualities, and eventually remanufacturing or disassembly (Bocken and Ritala, 2022; Bockholt et al., 2020). Reducing the loss and capturing the value requires multi-actor collaboration which supports that a take-back value stream can effectively and efficiently collect products for a second or third life with a new customer (Marke et al., 2020; Moalem and Kerndrup, 2022; Yang et al., 2017). Though not all involved actors might be aligned with the goal of retaining as much functional value of the discarded products. In fact, one cannot take for granted that all the actors involved strive for this goal. The misalignment of goals creates transaction costs and reduces the value that can be captured from reusing the resources of the discarded products (Williamson, 1998).
In this paper we will study the need for multi-actor collaboration based on an illustrative case of whitegoods that entail an obvious potential for capturing significant functional value when all actors are aligned on this goal. Whitegoods (e.g. dishwashers and washing machines) are an e-waste category with a large reuse potential, and the largest potential (economic, social, and environmental) lies in preparing end-of-life products for reuse (Zacho et al., 2018). However, substantial value is lost in value streams bringing a discarded product to a reuse facility; one reason being that products are subjected to rough treatment by actors in the value stream (Dalhammar et al., 2021; Johnson et al., 2020). The lost value is in essence ‘uncaptured value’ that has the potential to be captured through collaboration among the actors involved (Yang et al., 2017). Thus, a broader perspective that includes the transaction costs due to misalignment is necessary to reframe collaboration and interactions between companies in a circular economy. This study contributes with knowledge about the impact of collaboration for capturing value, and thereby respond to the call for studies of the reuse sector (Dalhammar et al., 2021; Islam and Huda, 2018) and particularly through case studies .
The perspective of value capture through collaboration in value streams is explored in this paper through a multiple case study investigating several value streams of whitegoods of two re-processing companies. This study explores value streams, actors, and their collaboration with the purpose of identifying characteristics of take-back value streams, thereby contributing with knowledge that can inform future design of take-back value streams and system for maximum value capture. The study does so by addressing the following research question: “How are take-back system value streams with low uncaptured value characterized?”
Alignment for circular transactions
Circular economy is an industrial economy that is restorative and regenerative, with a focus on keeping materials, products, and components at their highest utility and value at all times (Bockholt et al., 2020). Circular economy separates into five resources loops: share, maintain/prolong, reuse/redistribute, refurbish/remanufacture, and recycle (The Ellen MacArthur Foundation, 2013). Share and maintain aim at keeping the products with a customer for as long as possible by e.g. sharing a car or maintaining a washing machine to increase its lifespan. Reuse is a waste prevention initiative covering ‘any operation by which products or components that are not waste are used again for the same purpose for which they were conceived’ through being reused in manufacturing or directly resold (The Ellen MacArthur Foundation, 2013). Repairing and cleaning of a used washing machine and selling it as used exemplifies reuse. Refurbishment or remanufacturing involve restoring a product into a functional state: Refurbishment is limited to bringing a product to a specific quality level, whereas remanufacturing entails bringing “used products up to quality standards that are as rigorous as those for new products” (Thierry et al., 1995, p. 119). Recycling is any recovery operation by which waste materials are reprocessed into products, materials, or substances whether for the original or other purposes (EU, 2008).
The choice between reusing and recycling is not always straight forward: The choice depends on several factors; volumes, embedded value, energy used for reprocessing, ease of access, energy mix consumed during usage, cost of disassembly (Atasu et al., 2021; Bockholt et al., 2020; Boldoczki et al., 2020). From a circular economy perspective, the aim is clear; minimization of resource input, waste, emissions, and energy leakage (Geissdoerfer et al., 2017). Consequently, the value creation of a circular economy system as take-back becomes closely associated with prolonging and reusing products and materials emphasizing that value creation comes from e.g. capturing value in the form of resources.
Systematic alignment
From a strategic perspective policies are increasingly changing market conditions towards increased circularity acting as external forces inducing a need for change in companies. A key element in facilitating the change towards better use of the resources and realize the potential advantages is to create ‘systematic alignment among strategy, structure and culture’ among the actors (Semler, 1997, p. 28). Without this alignment among the actors’ transaction costs and inefficiencies will emerge. Transactions costs will appear as ex-ante negotiation and contracting costs between the involved actors and ex-post such monitoring or adaptation costs (Williamson, 1998). With higher levels of alignment comes reduction of transaction costs and barriers for cooperation, barriers that would otherwise reduce the efficiency and effectiveness towards achieving the chosen strategy. A widespread approach to analyzing value in processes is the method of value stream mapping (Rother and Shook, 1999), which we will apply to show how the behavior of the involved actors are affecting the value capture.
Value creation
Uncaptured value exists in and between organizations and is both tangible and intangible: Intangible uncaptured value can be over capacity of labor, insufficient use of expertise and knowledge, and the tangible uncaptured value can be waste streams in production, under-utilized resources, and reusable components embedded in discarded products (Yang et al., 2017). One source of uncaptured value is the failed value exchange which is a result of collaboration between stakeholders of value stream thus it represents a potential to capture more value (Yang et al., 2017). However, the configuration of a value stream to reduce the failed value exchange could increase the transaction cost as more time is needed to handle products (Williamson, 1998). One approach to avoid increasing the transaction cost is for companies to establish long-term relationships, an approach which is well-aligned with the inherent values in the circular economy.
Research design
This paper adopts a case study approach to explore value streams of pre-owned whitegoods bound for reuse, refurbishment or recycling. A case study method is suited for addressing ‘how’ and ‘why’ type questions when performing an in-depth analysis of a complex phenomenon in its real-life context (Yin, 2009). In the context of a take-back system for pre-owned whitegoods, data collection from persons with deep inside knowledge enables the study of the intricate and situated characteristics of the value stream, actors, and the value creation.
Data collection and analysis
The data sources are value stream maps developed together with persons with inside knowledge from the case companies. Value stream mapping is a visualization of activity and actors of a process that produces a product or a service, and the purpose of mapping a value stream is to identify opportunities for removing waste and increase the value creation (Rother and Shook, 1999). This study maps the take-back value streams to identify the key characteristics of value streams with minimum loss of units and the highest reuse potential; i.e the value streams with the highest value creation. The value stream mapping method is chosen to explore the operations details of a case company, and to explore the potentials for value creation particularly between actors (Forno et al., 2014; Rother and Shook, 1999). The study is divided into four steps (see Figure 1).
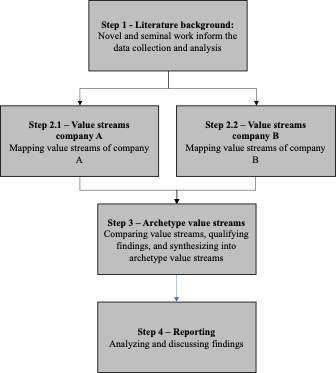 |
| Figure 1 – The study method. |
- Step 1: Background: Establish a literature informed foundation for mapping and analysis based on the current research within take-back and reuse of whitegoods.
- Step 2.1 + 2.2: Mapping the different value streams of each company with persons with key insights during individual workshop with each company. The mapping was done with the first author acting as facilitator. The mapping took place by:
- Identification of the main value streams where most products flowed through or most value was created
- Mapping activities and actors of each value stream
- Estimation of value potential, value loss, and value creation. The informants were asked to estimate these numbers based on their experience.
- Step 3: Synthesizing the value streams of company A and B into four archetype value streams with estimated value potential, loss and creation, and the key characteristics associated with value estimates. A conservative perspective on value was applied: When the estimated value potentials differed between informants the lowest value potential was chosen and regarding value loss the highest was chosen.
- Step 4: Identification, presentation, and discussion of findings and the contributions to research and practitioners.
Case companies
Data was collected from two Danish companies reprocessing whitegoods. The case companies were selected through purposeful sampling.
Case company A existed from 2019-2022. Company A was a privately owned company established with the purpose of creating a profit by reusing and refurbishing whitegoods and selling to B2C and B2B customers. The company had a combined workshop and store near greater Copenhagen. The main supplier of raw material (Used whitegoods) was the largest Danish retailer of whitegoods, which was supplemented with used whitegoods from othersources. Company A closed in 2022 because of a lack of interested investors. Case company B was established in 2019 and still operates and is partly owned by a company running the recycling stations. The company operates in North Denmark and was initially established to investigate the potential for reusing whitegoods. The main supplier of whitegoods is the public collection streams where citizens can turn in their whitegoods at predetermined locations. The company has a workshop, two physical stores, and a web shop.
Findings
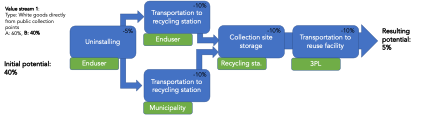
The study identified four distinct value streams with distinct configuration and potential value creation (See Figure 2). The blue boxes are activities, the green boxes are the actors responsible for the activity, and the number in upper-right corner of the activity is the %-points of volume lost to damage incurred from the activity. Logistic partners hired to handle uninstalling and moving machines are given the generic label 3rd party logistic provider (3PL) as their service is comparable across value streams. The value streams’ initial potential are written to the left and the resulting potential to the right. The four value streams were not active simultaneously but represent the main value streams identified with the two companies. Value stream 1 and 3 were identified with both company A and B whereas value stream 2 and 4 was only identified with company A.
 |
 |
 |
 |
| Figure 2 – Value streams 1-4 |
Value potential and loss
For each of the archetype value streams a potential was estimated by the informants. The initial potential of each value stream is an estimate by the informants of how large a percentage of the available machines could be restored into a second life and thereby retain their functional value. E.g. in value stream 1 40% of the machines were estimated to have an initial potential for reuse or refurbishment (See Figure 2). The resulting potential is calculated by subtracting the estimated volume loss (i.e. value loss) incurred through each of the value stream activities from the initial potential; e.g. in value stream 1 the resulting potential is 5% as a consequence of 35% value loss through the four activities in the value stream. Value stream 1 and 4 has the lowest resulting potential mainly due to significant value loss through the value stream. The loss of value (e.g. the 35% in value stream 1) is the failed value exchange primarily resulting from value damaged (Yang et al., 2017). Value stream 3 has the highest resulting potential of 65% because of a high initial potential and also a low loss of value from the activities (10% loss in total).
Archetype value streams
Each of the four value streams has a unique set of characteristics (See Table 1). Value stream 1 concerns the units collected from public collection points organized by the municipalities under the Extended Producer Responsibility (EPR) scheme. Units have a low acquisition cost but come with an annual fee for the processing company to be approved and continuously certified by the national producer responsible organization running the EPR collection. There are numerous actors involved and few are directly incentivized to handle units to avoid value loss, e.g. most units are stored outside at recycling stations and during transport units are handled roughly. Value stream 2 concerns units that have briefly been installed at a customer and returned under warranty, or units that have been deemed unfit for sale at retail often because of transport damage to packaging or product. These units have a high acquisition cost, are relatively new, and have little wear and tear. There are several actors involved which expectedly have some knowledge about the reuse potential, and in contrast to value stream 1 these products are stored inside a warehouse and not exposed to outdoor climate. The units are uninstalled by a 3rd party and stored at a logistic center hired by the retailer, and the unit ownership resides with the retailer prior to being sold to a reprocessing company. Information about why the unit has been returned is not documented and is lost. This lack of unit specific information regarding why products are returned increases the cost of reuse; e.g. some units are returned because of a scratch whereas other has a functional issue, however reprocessing technicians treat all products alike due to lack of information. Value stream 3 concerns units acquired through a renovation company involved in renovation of offices or apartments. These units have a medium acquisition cost, are in good functional condition but tend to be older with some wear and tear. There are few actors and few steps in the value stream. Units are treated carefully during transport and often driven directly to the reprocessing facility and not stored intermediately. The end-users for whom the machine has no more use are often renovation companies with an interest in sharing the story with their customers in a branding campaign depicting them as a partner with a sustainable and waste reducing approach. The value stream actors share information about volume and type and the purpose of moving the unit; e.g. units are uninstalled by unscrewing the plug and not cutting the wire with the latter being a practice that increases the reuse cost. Unit specific information is not documented like value stream 2. Value stream 4 concerns units that are discarded at an end-user and removed through a retailer when the end-user acquires a new product through the retailer. These units have a medium acquisition cost and high levels of wear and tear. These products are handed roughly, in some cases valuable products disappeared during transport, and the logistic company handling the operations tend to focus on being quick to reduce their cost. No information regarding product functionality is documented.
| Table 1 – Characteristics of the value streams | |||||||
| Value stream | Company | Acquisition Cost | Information sharing | Main actors | Product age | External forces | |
| 1 | Company A & B | Low | No | Public | Old | Policy | |
| 2 | Company A | High | No | Private | New | Warranty | |
| 3 | Company A & B | Medium | Volume and type | Private | Medium – old | Market | |
| 4 | Company A | Medium | No | Private | Old | Market | |
Value stream actors
For each value stream activity an associated actor is identified, and while some actors are specific for a value stream (e.g. retail in value stream 2) then logistic actors have a similar role in all value streams however their approach is different and defining for volume loss (i.e. value loss). Logistic actors in value stream 1 are the municipality or the end-user that transports unit to a public collection site often taking little consideration to avoid damages (i.e. value loss). In value stream 2, 3 and 4 a 3rd party logistics provider is typically responsible for uninstalling, loading on to a truck, driving, and unloading at the reuse company. Typically, the 3rd party logistics provider does the uninstalling when delivering and installing a new machine, and often the logistic companies are focused on speed except for value stream 3 where the logistic company prioritized proper uninstalling and considerate handling. Recycling stations are the public collection sites where private households can take discarded goods. Company B collects products for reuse from a local recycling station, but most products collected at recycling stations are recycled. Retail actors are typically focused on selling new products and maximizing the financial value they can gain from products discarded by end-users. Retail actors typically charge end-users a fee for removing the old product, and retail also charge a fee for each machine sold to a reprocessing company including machines that cannot be reused.
Discussion
The study finds that in value stream 1 an estimated 5% is fit for reuse which is in line with previous estimates of 1.5% (Johnson et al., 2020), especially considering that the case companies sold products with dents which are not included in the 1.5%. Other findings suggest that 13-16% of Waste Electrical and Electronic Equipment (WEEE) could immediately be prepared for re-use, and because 86% of damage to WEEE is caused by exposure to the outdoor climate and handling, the potential for reuse could be as high as 29% (Messmann et al., 2019). This is not only whitegoods but WEEE in general, however the result of this study supports the claim that substantial value is lost in the value stream through moving and storing products with little regard for their functional or visual value.
The findings of the value stream analysis have yielded one proposition to answer the research question “How are take-back system value streams with low uncaptured value characterized?”: ‘Proposition 1 – Alignment between actors’.
Alignment between actors
This study proposes that: Value creation in a take-back value stream is dependent on alignment between actors towards treating products according to the expected outcome.
Rough handling of products results in both functional and visual damage (Dalhammar et al., 2021; Johnson et al., 2020), and this study finds that purpose alignment between actors impacts how products are handled and reduces the value destroyed and thus increase the value captured. As observed in value stream 3 alignment was achieved through multi-stakeholder collaboration where a higher transaction cost was accepted due to the purpose with the value stream of capturing value as agreed upon by the actors: Building owner wanted sustainable renovation, renovation company could offer a sustainable solution including reuse of whitegoods, and logistics partner uninstalled and moved to retain functional value. In value stream 4 there was little alignment of purpose resulting in suboptimization: Units lost functional value when logistic partners handled products roughly to hurry and reduce their operational cost. Proposition 1 is in line with previous research highlighting that reframing the mindset of actors can create new opportunities for value creation (Marke et al., 2020; Moalem and Kerndrup, 2022; Yang et al., 2017). Proposition 1 challenges the idea of reduction of transaction cost as a lever to create growth (Williamson, 1998), and propose that the transaction be viewed as a value creator that can facilitate growth.
Conclusion
The study demonstrates that value streams capable of capturing value are characterized by alignment of purpose between actors which are instrumental in shaping their collaboration and outcome of transactions. Transaction cost theory posits that an optimal organizational structure achieves economic efficiency by minimizing the cost of exchange. Organizations that facilitate low transaction costs boost economic growth. However, with the shift from a linear to a circular economy where economic growth must be decoupled from extracting resources from nature, a novel regenerative transaction cost theory can facilitate a change in value stream collaboration. To capture value organizations and their collaborators must adopt a perspective where products not needed by customers are not considered waste but as a source of value creation and initiate or expand their reuse activities to capture the value (Zacho et al., 2018). The change is an entrepreneurial endeavor needed to reach a state where value potentials are not considered pre-existing but as co-created between actors (Moalem and Kerndrup, 2022).The transition to a circular economy is a leaderless process; no one person or organization can lead with authority instead the transition is a transformational process to reshape the collaboration between the responsible and participating actors. Therefore, an individual and collective change of mindset is an imperative initial step to stop destroying waste and create value.
References
Atasu, A., Dumas, C. and Van Wassenhove, L.N, (2021), “The Circular Business Model”, Harvard Business Review, pp. 1–16.
Bocken, N. and Ritala, P. (2022), “Six ways to build circular business models”, Journal of Business Strategy, Vol. 43, No. 3, pp. 184–192.
Bocken, N.M.P., de Pauw, I., Bakker, C. and van der Grinten, B. (2016), “Product design and business model strategies for a circular economy”, Journal of Industrial and Production Engineering, Vol. 33, No. 5, pp. 308–320.
Bockholt, M.T., Hemdrup Kristensen, J., Colli, M., Meulengracht Jensen, P. and Vejrum Wæhrens, B. (2020), “Exploring factors affecting the financial performance of end-of-life take-back program in a discrete manufacturing context”, Journal of Cleaner Production, Vol. 258.
Boldoczki, S., Thorenz, A. and Tuma, A. (2020), “The environmental impacts of preparation for reuse: A case study of WEEE reuse in Germany”, Journal of Cleaner Production, Vol. 252.
Dalhammar, C., Wihlborg, E., Milios, L., Richter, J.L., Svensson-Höglund, S., Russell, J. and Thidell, Å. (2021), “Enabling Reuse in Extended Producer Responsibility Schemes for White Goods: Legal and Organisational Conditions for Connecting Resource Flows and Actors”, Circular Economy and Sustainability, Vol. 1 No. 2, pp. 671–695.
EU. (2008), EU Waste Directive 2008/98/EC.
Forno, A.J.D., Pereira, F.A., Forcellini, F.A. and Kipper, L.M. (2014), “Value stream mapping: A study about the problems and challenges found in the literature from the past 15 years about application of Lean tools”, International Journal of Advanced Manufacturing Technology, Vol. 72 No. 5–8, pp. 779–790.
Geissdoerfer, M., Savaget, P., Bocken, N.M.P. and Hultink, E.J. (2017), “The Circular Economy – A new sustainability paradigm?”, Journal of Cleaner Production, Vol. 143, pp. 757-768.
Islam, M.T. and Huda, N. (2018), “Reverse logistics and closed-loop supply chain of Waste Electrical and Electronic Equipment (WEEE)/E-waste: A comprehensive literature review”, Resources, Conservation and Recycling, Vol. 137, pp. 48-75.
Johnson, M., McMahon, K. and Fitzpatrick, C. (2020), “A preparation for reuse trial of washing machines in Ireland”, Sustainability (Switzerland), Vol. 12 No. 3.
Lewandowski, M. (2016), “Designing the business models for circular economy-towards the conceptual framework”, Sustainability (Switzerland), Vol. 8 No. 1.
Marke, A., Chan, C., Taskin, G. and Hacking, T. (2020), “Reducing e-waste in China’s mobile electronics industry: the application of the innovative circular business models”, Asian Education and Development Studies, Vol. 9, No. 4, pp. 591–610.
Messmann, L., Boldoczki, S., Thorenz, A. and Tuma, A. (2019), “Potentials of preparation for reuse: A case study at collection points in the German state of Bavaria”, Journal of Cleaner Production, Vol. 211, pp. 1534–1546.
Moalem, R.M. and Kerndrup, S. (2022), “The entrepreneurial role of waste companies in transforming waste streams to value streams: Lessons from a Danish Municipal waste company”, Waste Management and Research, Vol. 43, Nr. 3.
Rother, M. and Shook, J. (1999), Learning to See: Value Stream Mapping to Add Value and Eliminate Muda, The Lean Enterprise Institute, Inc., Brookline, MA.
Semler, S.W. (1997), “Systematic Agreement: A Theory of Organizational Alignment”, Human Resource Development Quarterly, Vol. 8 No. 1.
The Ellen MacArthur Foundation. (2013), Towards the Circular Economy Vol. 1: An Eco-Nomic and Business Rationale for an Accelerated Transition.
Thierry, M., Salomon, M., Van, J., Luk, N. and Wassenhove, V. (1995), “Strategic Issues in Product Recovery Management”, California Management Review, Vol. 37 No. 2.
Williamson, O.E. (1998), “Transaction cost economics: How it works and where is it headed”, De Economist, Vol. 147, No. 1, pp. 23-58.
Yang, M., Evans, S., Vladimirova, D. and Rana, P. (2017), “Value uncaptured perspective for sustainable business model innovation”, Journal of Cleaner Production, Vol. 140, pp. 1794–1804.
Yin, R.K. (2009), Case Study Research: Design and Methods, 5th ed., SAGE.
Zacho, K.O., Mosgaard, M. and Riisgaard, H. (2018), “Capturing uncaptured values – A Danish case study on municipal preparation for reuse and recycling of waste”, Resources, Conservation and Recycling, Elsevier B.V., Vol. 136, pp. 297–305.